Live Map
Quick Links:
The Live Map interface consists of two main panels: the Channels Grid panel on the left and the Map panel on the right.
- In the Channels Grid panel you can view the most recent data readings, stats and summaries for all your sites and channels.
- The Map panel displays a geographic representation of your data. View data for your sites and channels by clicking the the respective site's icon on a Google Maps style interface.
- By default, both map and grid show all the sites (and associated channels) owned by your account.
- Clicks on the Channels Grid are mirrored on the Map, and vice versa.
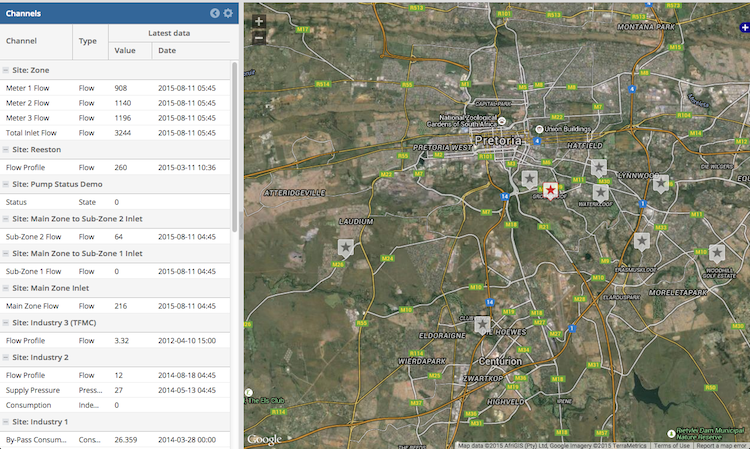
Live Map view with Channels Grid panel on the left and Map panel on the right.
Channels Grid
By default the Channels Grid is grouped by site and shows the most recent data value imported for each of your channels. The grid checks for new data on Zednet every 5 minutes and updates itself accordingly.
Note: Most loggers however only transmit data to Zednet every 6 to 12 hours to save battery power.
The Channels Grid can be optionally collapsed (or expanded) by clicking on the arrow in its header. You can also configure how the grid and map respond to actions by clicking on the gear icon in header.
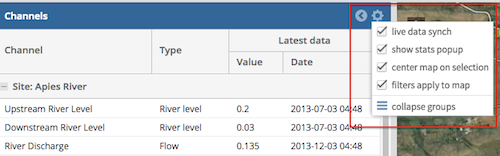
Click the arrow in the blue header of the Channels Grid panel to collapse or expand the grid. Click the gear icon in the same header to configure the grid and map.
Working with the grid
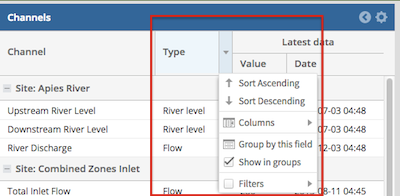
The grid header allows you to alter what is displayed in the Channels Grid. You can filter, sort and group columns in the grid by clicking the arrow on the right side of any column heading.
How to manipulate the grid:
- Click the arrow on the right side of any column to show an options menu.
- Most columns can be filtered. By default these filters also affect the map - click on the gear on blue panel to change the behaviour.
- The column header also allows you to change grouping, and show/hide specific columns.
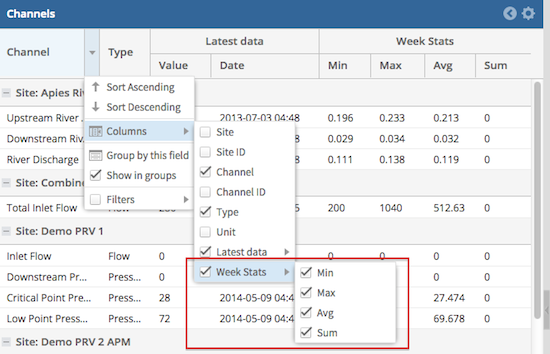
- You can also show a week of summary data by enabling the respective "Week Stats" column on the grid.
The Map
On the Map panel sites and channels (or points of measurement) are represented by a star icon giving a spatial overview of the water system. For some use cases, this is a more efficient way of gaining an overview of the water system than drilling down through the more detailed data interfaces.
Click on a red star to view a list of sites at the star's location. A grey star represents a single site at its given location. Zoom in to view a finer grained detail of the map and exact locations of sites.
Once you have selected a site you can view its channel summary or open the sites full details in the Live Data interface.
Note: The map allows for various options native to 'Google Maps' which include zooming, satellite view, street view etc.
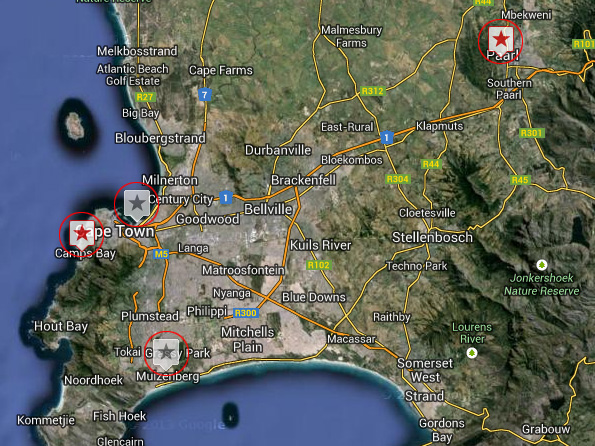
Live Map with channels of data
Working with the map
The map can be viewed in various ways (eg, satellite view or street view), allows for zooming in and out and also offers the manipulation of layers which are displayed on top of the map.
- Zooming: Roll the mouse wheel forwards and backwards to zoom in and out. OR click on the '+' and '-' buttons in the left corner of the map.
- Layers: Click on the blue tab with white '+' icon in the top right hand corner of the map to view 'Layer' options.
From the drop down menu select how you would like the map to be viewed.
Note: You can choose Satellite view, Streets view, Physical view or a Hybrid of them in combination - Overlays: You can also select which layers you would like to display over the map (e.g., a previously marked out region/zone or your own GIS asset representing spatial data related to your system).
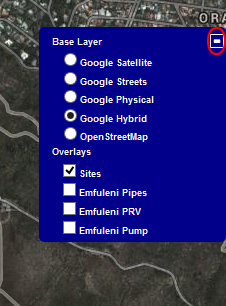
Live Map layers and overlays options
Viewing and manipulating channel data
How to select a site and view it's summary and channel data:
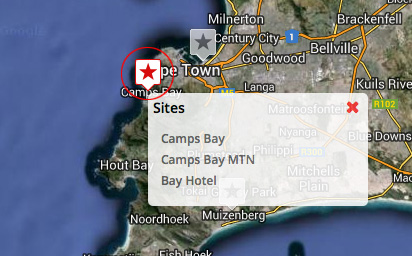
- To select a site, simply click on the star icon that pinpoints the location the site you're interested in.
- If you click on a red star you will see a list of sites at that location. Select a site from the list to view its summary.
- If you click on a grey star (only one site at that location) you will go directly to the summary for that site.
- While viewing the channel summary for a site, you can click 'show details' to view to launch the Live Data view in a new window and view the channel data.
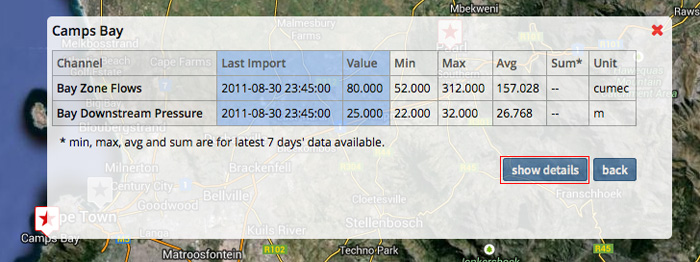
Note: When working with channel data for a site you are essentially viewing with the Live Data interface, so you can work with the data in the same way as you would using the Live Data interface.
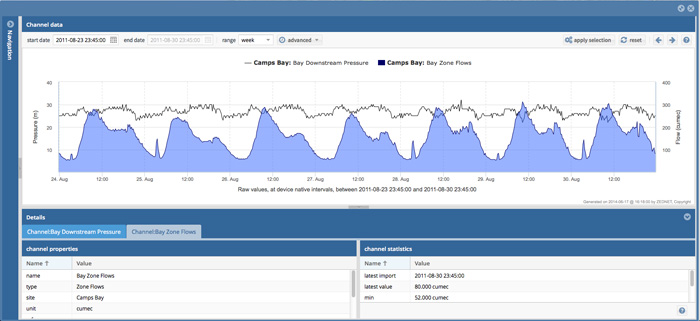
Live Data window opened through the Live Map interface